Analytics on Neki
Analytics play a crucial role in quantifying the effectiveness of your social impact efforts. By tracking key metrics such as page views, post impressions, engagement rates and more, you can measure the impact of your brand as a result of storytelling and campaigning. Neki, as a social impact platform, offers detailed insights into your public page for your Nonprofit or Company, helping you make data-driven decisions to enhance engagement, awareness and brand value.
- Home Page Analytics
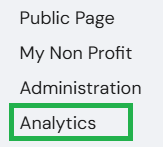
Upon logging in, the analytics option is available on the right side of the Home Page. Clicking on it provides access to a detailed analytics page with in-depth insights into social impact activities and performance on the platform.
For Mobile :
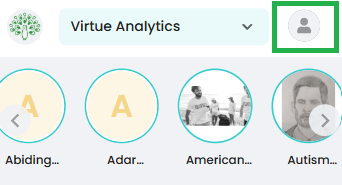
On Home Page, Click on Profile Picture.
Click on ‘Analytics

2. Detailed Analytics Page
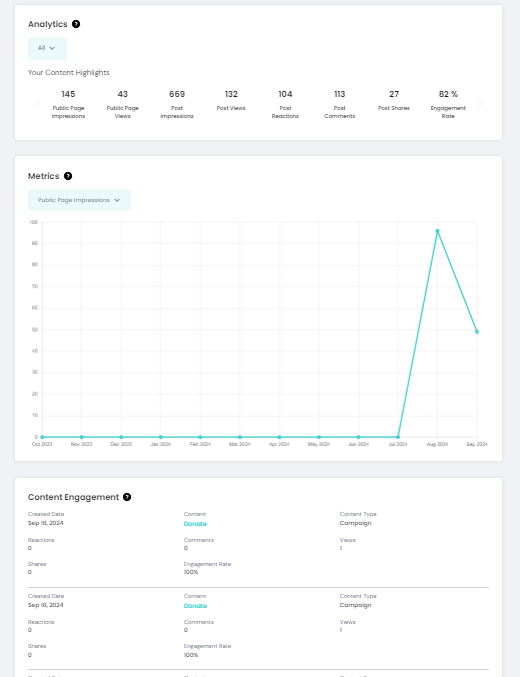
Here are the key analytics metrics available on Neki:
Public Page Views: This metric represents the total number of times your public page has been viewed by users. It indicates the level of interest and visibility your page has garnered.
Post Impressions: This refers to the number of times your posts have been displayed to users, regardless of whether they were clicked or engaged with. It provides insight into the reach of your content.
Engagement Rate: This percentage reflects the level of user interaction with your content, calculated by dividing the number of engagements (such as likes, comments, and shares) by the total number of impressions. A higher engagement rate signifies more active user participation.
Formula:
Engagement Rate = ((Clicks+ Reactions + Comments + Shares + Views)/Impressions) *100
Impressions: Impressions count how many times your content is displayed or seen even for a fraction of a second, regardless of level of engagement of the user.
Views: Views depict the number of times the content has been displayed where the user has taken the time to read it.
Public Page Impressions: Similar to post impressions, this metric counts the number of times your public page has been shown to users, offering a broader view of your page's reach beyond individual posts.
Post Views: This indicates the number of times your posts have been viewed by users. Unlike impressions, which count each display of the post, views typically count only when a user actively engages with the post by clicking on it.
Post Reactions: This metric tallies the total number of reactions (such as likes, loves, wows, etc.) your posts have received, reflecting the emotional response of your audience to your content.
Post Comments: This represents the number of comments users have left on your posts, indicating the level of discussion and interaction your content has generated.
Post Shares: This counts the number of times your posts have been shared by users, amplifying your content's reach as it spreads through user networks.


